Estimated Reading Time [est_time]
The thing about website analytics data is that without it, you are running blind.
Without it, you wouldn’t know if anyone was finding your website, let alone visiting other pages and trying to engage with your business.
I class myself as an expert when it comes to communicating data trends and analytics to clients and partners. I have built up a successful team who helps make sense of the data and communicates that back to our clients in a digestible format to base decisions upon.
All too often businesses and organisations are not seeing the end results they want, or deserve, however their agency reports are telling another story.
Often, they are being provided with analytics reports which only highlight potential positives rather than the true picture. I find this highly frustrating as often the client is not even aware of this, and where they are aware, they are not sure what to do when faced with this situation.
We work with businesses to discover the truth (the good, the bad and the ugly truth) and help businesses understand their digital footprint from digital data.
Why should you trust what I say?
(Other than my 18 years experience, by all means speak to any of my clients both current and past), you don’t have to trust me yet, trust has to be earned. However, we focus on questioning the data, so before you even question if I am trustworthy or not, try it yourself. Question your own data.
A wise man once said:
“Torture the data, and it will confess to anything.” – Ronald Coase, Economics, Nobel prize Laureate
Data is great. It can help you understand what is happening on your website and how users are engaging, usability funnels, conversions, sales, video views etc… However it can also be a poison chalice.
All too many times I see clients, or other agencies, reading the data incorrectly and this results in inaccurate reporting and therefore bad decisions ensue.
With some further questioning you can normally get much more out of the analysis than you might even imagine.
TIP: Beware of what lies in the detail of averages and volume.
EXAMPLE
If I see 100% uplift in traffic – that may sound like a good result! Right?
But if that uplift is from 1 visitor to 2 then it is not even worth a mention. It means near to nothing.
If I only see an uplift of 1% – you may dismiss it! Right?
But if that’s a 1% uplift on 1 million visitors to the website, then that is an uplift of 10,000.
Depending on your goals this may still not be important to you.
But if you convert on average 1% of visitors to your site into an enquiry or purchase that equals an uplift of approximately 100 conversions.
Breaking this down by the percentage is only important based on volume. If the volume is there then it can be a good gauge.
The conversion rate is also important if you are running a projection on the possible increase in conversions. 1% might be the average of the website conversion rate. This does not mean every click to the site results in 1% conversion – this would mean every customer only partly converts! Not possible.
It means that on average about 1% of total visitors convert. That figure will fluctuate based on the time, the volume, the channel, and so the more granular you go the more the calculation changes. Let’s bear this in mind when reporting on percentages.
An average conversion rate of 1% from 10k visitors could receive more or less than 100 conversions. As it’s an average figure, some visitors will convert at a higher rate, whilst others will convert at a lower rate.
Tip: Always question and compare your times.
EXAMPLE
This week we were up 20% in clicks on last week.
So what?
Maybe start by asking:
- Was last week good or bad?
- What have the clicks resulted in?
- Where did they come from?
- Why did they happen?
- Did you spend more budget as a result of that?
- Was there a marketing strategy change?
- Were you in the news?
- +++
Then ask:
- What was the weather last week?
- What current affairs were occurring?
- Was it the end of the month or start of the month?
- Had customers just been paid?
- Is it the new financial year?
- Was there a market fluctuation?
- +++
Only by interrogating and questioning the data will you make any use of the information.
You can then be satisfied with where to go from here.
Now we know the basics, let’s look at a classic example of storytelling, manipulation of data and what to look out for when understanding your analytics reporting.
The story of the misleading bounce rate
Hi Client,
Great news, we improved the Bounce rate by 3.5%
What that means:
Not a lot without any context.
Questions to ask:
- How did “you” improve it?
- Did traffic increase and if so was it the new traffic which led to a better bounce rate?
- If less people bounced, does that mean they spent longer on the website?
- Were there more sales?
The Reality:
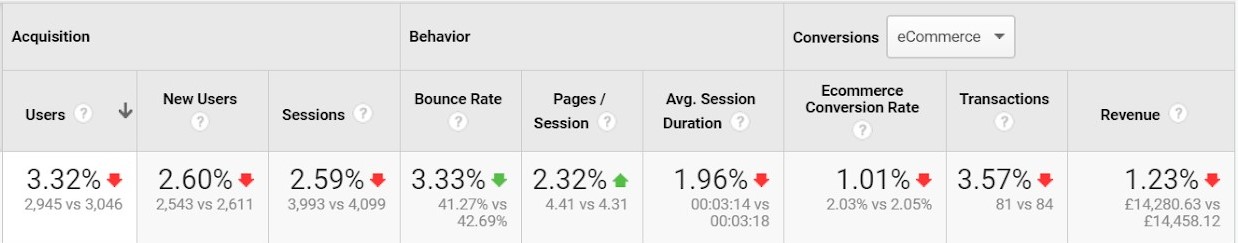
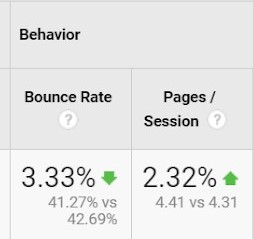
Bounce rate did improve by 3.33% but users also decreased, and the average session duration decreased!
If you calculate the number of users who didn’t bounce last week compared to this week the figures tell a different story:
This week:
- Users: 2,945
- Bounces: 1,215
- Non Bounces: 1,730
Last week:
- Users: 3,046
- Bounces: 1,300
- Non bounces: 1,746
In conclusion, 16 less users week on week did not bounce, out of nearly 3000 users! This demonstrates a classic example of taking one snippet of data and letting it lead into a positive story, whereas the actual picture may be quite different. Bounce rate being up may be the only positive (green metric), however there are many more important factors to report on rather than what turns out to be a fairly irrelevant figure.
If this is the case, it is not even worth me spending the time to calculate, unless those 16 users converted at a higher conversion rate with a strong AOV of course!
Also note that the transactions and revenue were only very marginally down by 3 transactions and a few hundred pounds.
The Moral of the Story
Ensure you know what actual numbers the percentages are reflecting before delving into the detail of the calculations.
Next, look at your end goal. In most cases this is revenue, return on investment (ROI), average order value (AOV), or transactions, to see if it is worth your time investigating. If your sales are level then you may be on a wild goose chase.
If you are struggling to make sense of your analytics or reporting and need an independent view on things, feel free to give us a call in confidence. We work with clients and agencies to drive businesses forward.


